Node-RED and WoTKit
A simple NR flow to scrape the weather for your city and visualize it on a chart in WoTKit
This example is designed to run a NR flow in FRED, the cloud based NR implementation. You can probably run it on a NR instance on PI, but I haven’t tested that.
Other tutorials for WoTKit and FRED are on our developer site
Overview. This is a simple example of using NR to read a data value from a website, which is then pushed to a WoTKit so it can be visualized using the WoTKit’s built in dashboards. The data is pushed every 15 minutes and stored with the virtual sensor in WoTKit. A WoTKit user can then visualize the sensor data using any of the standard WoTKit visualizations and place it on their dashboard.
Prerequisites: A FRED account and a WoTKit account
Steps
- Create a new sensor in your WoTKit account called something like VancouverWeather
- Create a new NR flow in FRED
- Connect up a weather input node to a timer and send the result out to the WoTKit
- Use the WoTKit UI to create a visualization for the VancouverWeather sensor and add it to your WoTKit dashboard
Creating the WoTKit sensor.
Login to your WotKit account.
If you don’t have one, register for free at wotkit.sensetecnic.com
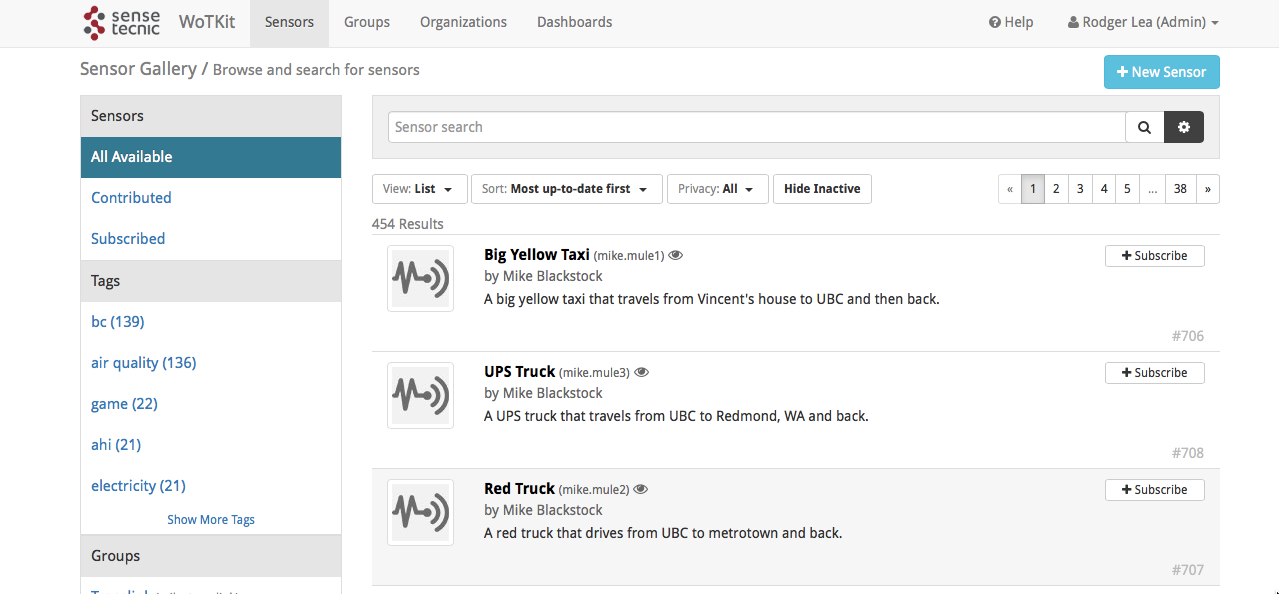
Select the “New Sensor” button; top right of the screen
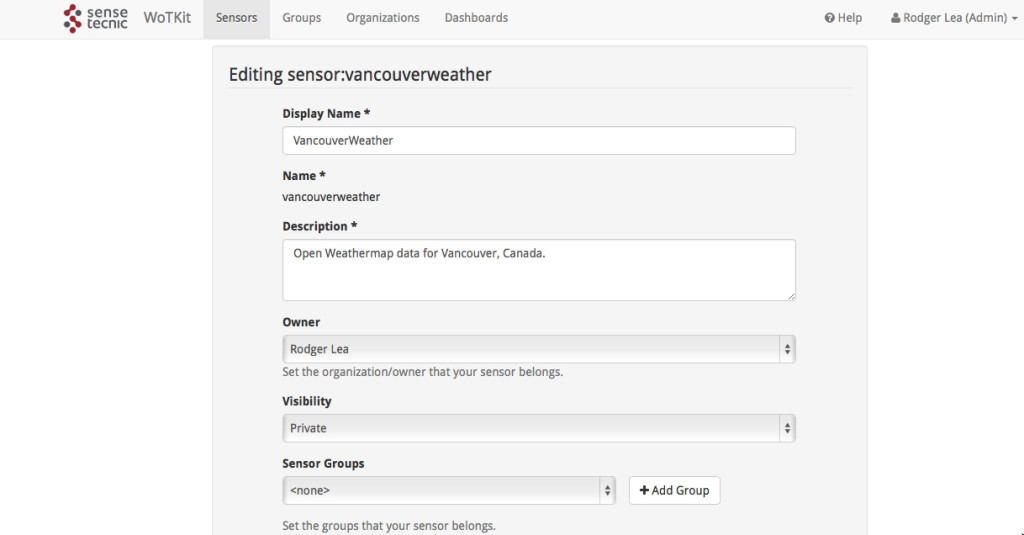
In the pop-up, give the sensor a name, eg VancouverWeather and a short description
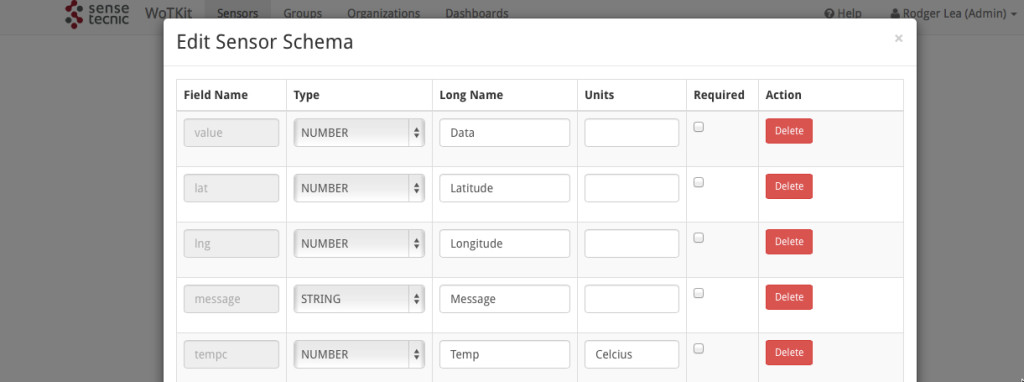
Lastly, we are going to tell the WoTKit what data we are going to send it – in our case we’ll start with a simple temperature value, which we’ll call “tempc”. To do that, scroll down and select edit fields. This pulls up a simple editor for the data fields the sensor will have. By default all sensors have 4 fields, <value> for their default data value, <lat>,<lng> for their location and <message> for a generic string message. We’re going to add a new field for the tempc value. Select add field, then name it “tempc” all lower case, select number to tell WoTKit this is a numeric field, give it a name and fill in celsius in the units field.
Once finished, click OK and then Submit on the sensor form and the new sensor will be created.
Your new sensor will be created and given default values for location etc. Note it’s full name, which should be <your_user_name>.vancouverweather and it’s ID, which will be a unique number. These are show under the Sensor name at the top of the page.
From here, login in to your FRED account and create a new tab in which we’ll code up our new flow.
Again, if you don’t have a FRED account, sign up for free at fred.sensetecnic.com
Next, select an inject node from the left pane and drag onto the flow canvas. Then, select a openweathermap request node from the left pane (under weather nodes) and drag that to the canvas.
Double click the openweathermap node and fill in the city and country – in our case Vancouver and Canada.
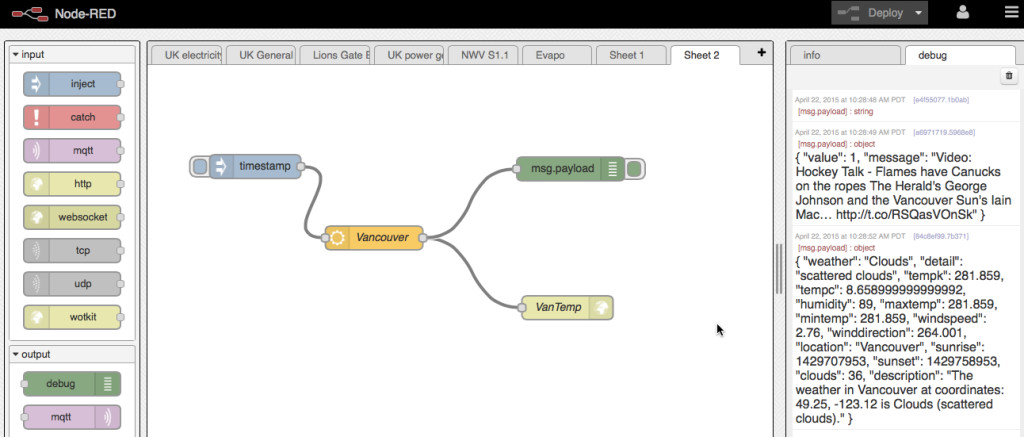
You can check it’s working by wiring the input node to the weather node, then dragging on a debug node and connecting the weather output to the debug node. Once you’ve wired everything together, deploy it (top right) and then you can test it by clicking the input node and looking at the debug output in the right pane of the Node-Red window.
As you can see, the openweathermap node outputs a JSON structure with a variety of weather data for the city you chose.
Our next task is to send it to the new weather node we created in WoTKit.
Now, because by default the WoTKit expects a JSON structure of name:value pairs for sensor data, we can, as a simple step, just send the results from the openweathermap node directly to WoTKit as is. To do that, we have to configure a WoTKit output node.
Drag a WoTKit output node from the left pane to the flow canvas, double click to configure. You’ll need to set up your WoTKit credentials (login name and password) under user, then name this node something meaningful. Finally in the sensor field, fill in the name of your sensor which you noted down when you created the sensor in WoTKit (something like <yourname>.vancouverweather.
To test this, wire the output of the openweathermap node to the WoTKit node and deploy.
Then click the input node a few times to get the weather and send the data across to the WoTKit sensor. After that, let’s setup the inject node to fire automatically every 15 minutes so we don’t have to keep clicking on it. Double click the inject node, in the fields set the repeat field to interval and set the time as every 15 minutes (or whatever you prefer).
Finally, login to the WoTKit and take a look at your new sensor, you should see something like this:
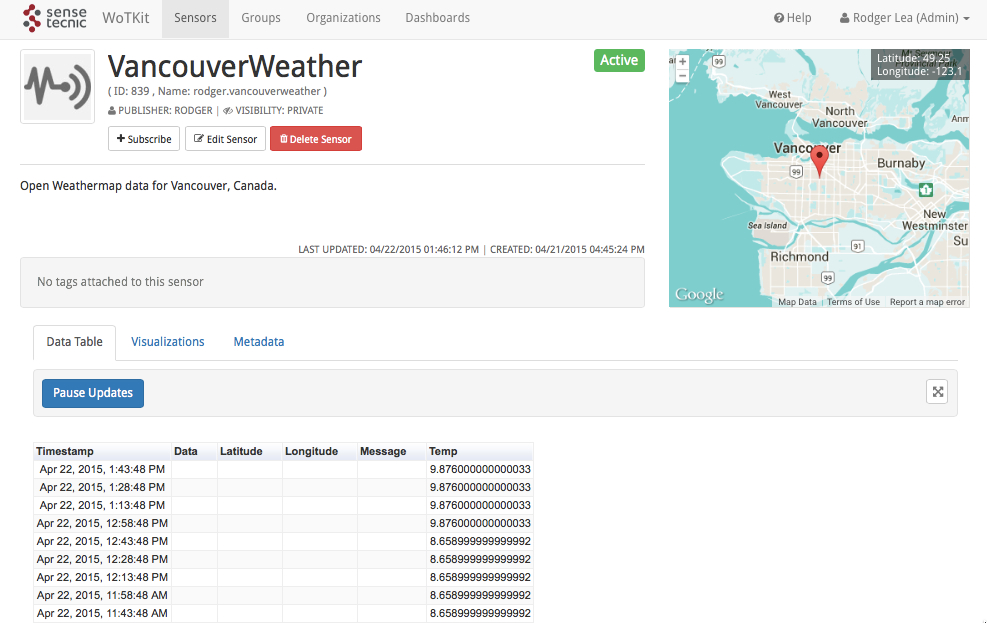
Very simple eh!
Now, because WoTKit is extremely flexible, we can simply go into the edit page for the sensor, and add in new fields. We know from the debug output in FRED that the weather sensor is sending quite a bit of data, so let’s pick another couple of fields and add those to the sensor. Let’s add a weather field, which is a string, and a winddirection field, which is a number. You add those in the same way you added the ‘tempc’ field before, submit the changes and you’ll see immediately that WoTKit displays the new fields! What’s more, because WoTKit’s been storing what you’ve sent, even though it didn’t have the fields configured, it can now show you historical data for the new weather and winddirection fields.

As you can see, the default WoTKit UI is extremely flexible and very powerful.
Lastly, let’s create simple line chart for the temperature and add that to your default dashboard in WoTKit.
From the sensor search page, select your weather sensor, select visualizations and play around with the different types of viz. Let’s chose a simple line chart. Select line chart in the visualization field, then type 100 in the buffer field to allow us to visualize the last 100 data values. Finally, by default WoTKit visualizes the default data field for any sensor. Since we aren’t sending a value for this field, select the data drop down and chose the temp field so we can see our ‘tempc’ data. You will now see a real time viz of the data with the last 100 data points (or as many as you’ve managed to send so far).
Once you’ve decided that this is the viz you want, you can build a widget and put it onto your dashboard. To do that, firstly select the build widget button. You’ll see a template like the following
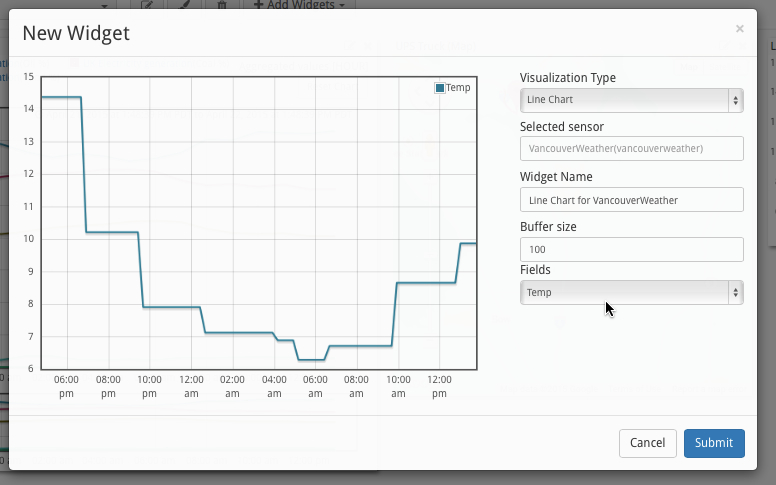
As before, select the chart type, buffer size and data field to visualize, you will also give the widget a name that will be displayed on your dashboard. Once you’re ready, hit submit and the widget will be created and added to your default dashboard. You’ll be taken to the default dashboard and you’ll be able to resize and position your new weather widget!
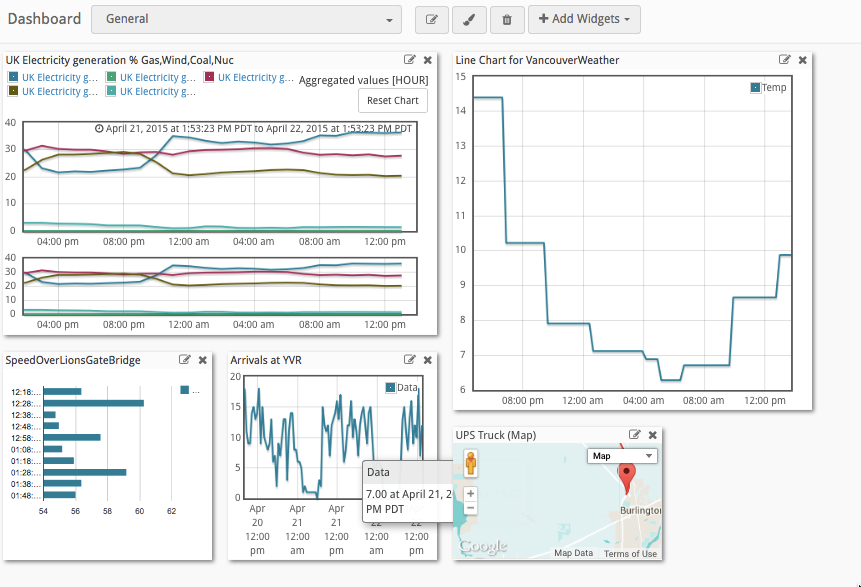
Like this …..